 Draw on a Map
US annual PM2.5 at monitors, 2025
Annual means of measured daily fine particle concentrations at US EPA monitors in 2025.
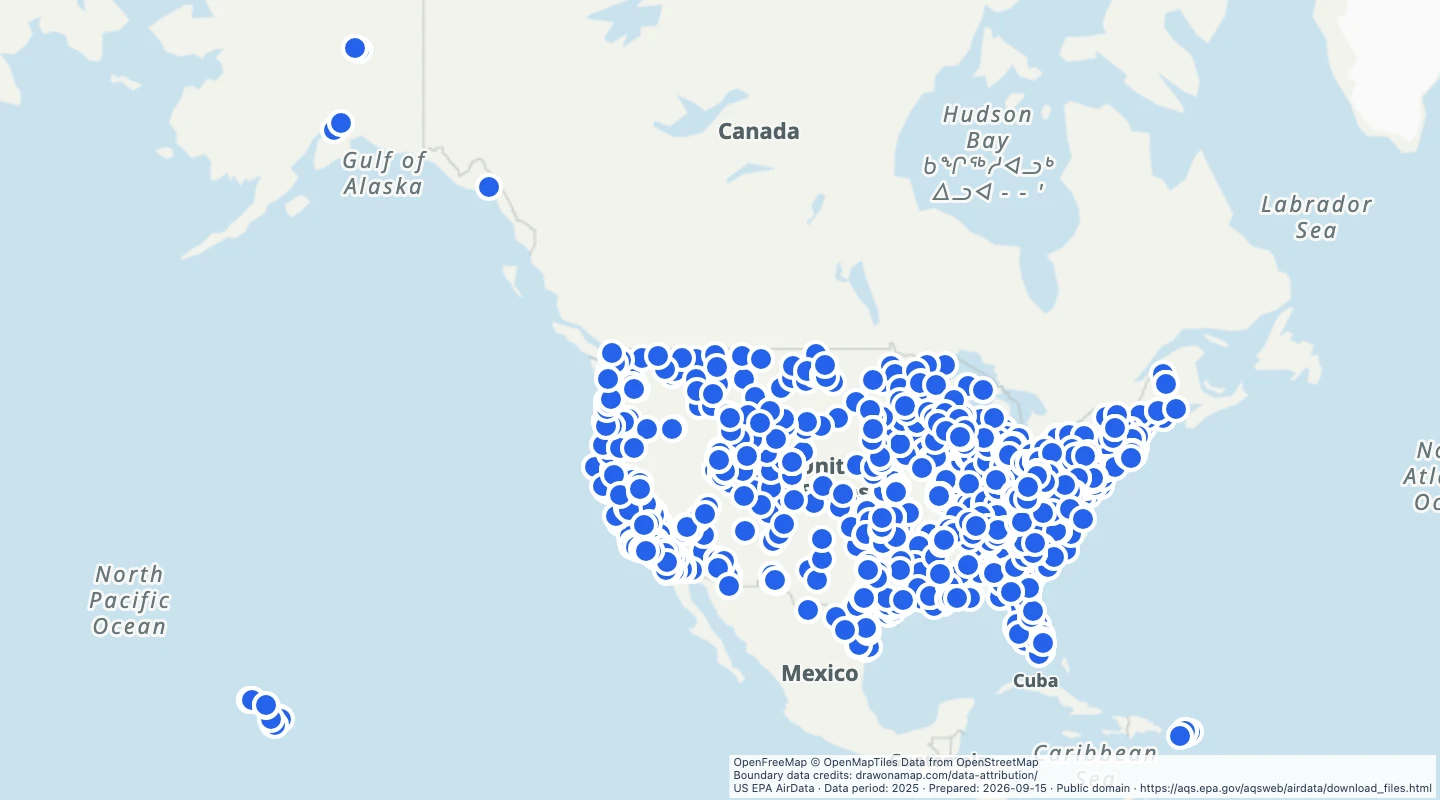
Inspect and select records
Choose values to filter the preview. Open or download the matching records.
Loading records from the map preview…
View record table
The table shows up to eight fields. The download keeps all fields and the original geometry.
About this dataset
- This view selects PM2.5 monitors in US states and territories and the daily mean metric for 2025. Foreign monitor records are excluded.
- The annual value is the source arithmetic mean of measured daily concentrations. The unit is micrograms per cubic metre at local conditions.
- Rows with exceptional events include those events. Separate event-exclusion rows and duplicate standards are removed.
- Use the mean, valid day count, and completeness flag to compare monitors. Some monitors do not meet the source completeness requirement.
- These are historical measurements, not live air quality or a regional risk forecast. The source file was retrieved on 15 September 2026.
Source and licence
Licence: Public domain
GeoJSON download details
The download includes all 1,529 features as points. Coordinates use longitude and latitude in WGS84.
The preparation date is when we prepared this dataset. Read the source notes for the dates covered by the data.
GeoJSON fields 9
name- Source monitoring site name, or county and monitor identifier.
monitor_id- State, county, site, and parameter occurrence codes.
pm25_mean- Arithmetic mean of measured daily PM2.5 concentrations in 2025.
units- Source concentration unit.
valid_days- Number of valid measured days used by EPA.
complete- Whether EPA marked the annual record complete.
state- US state or territory.
source_date- Date the source annual record was last changed.
source_url- EPA AirData source files.