 Draw on a Map
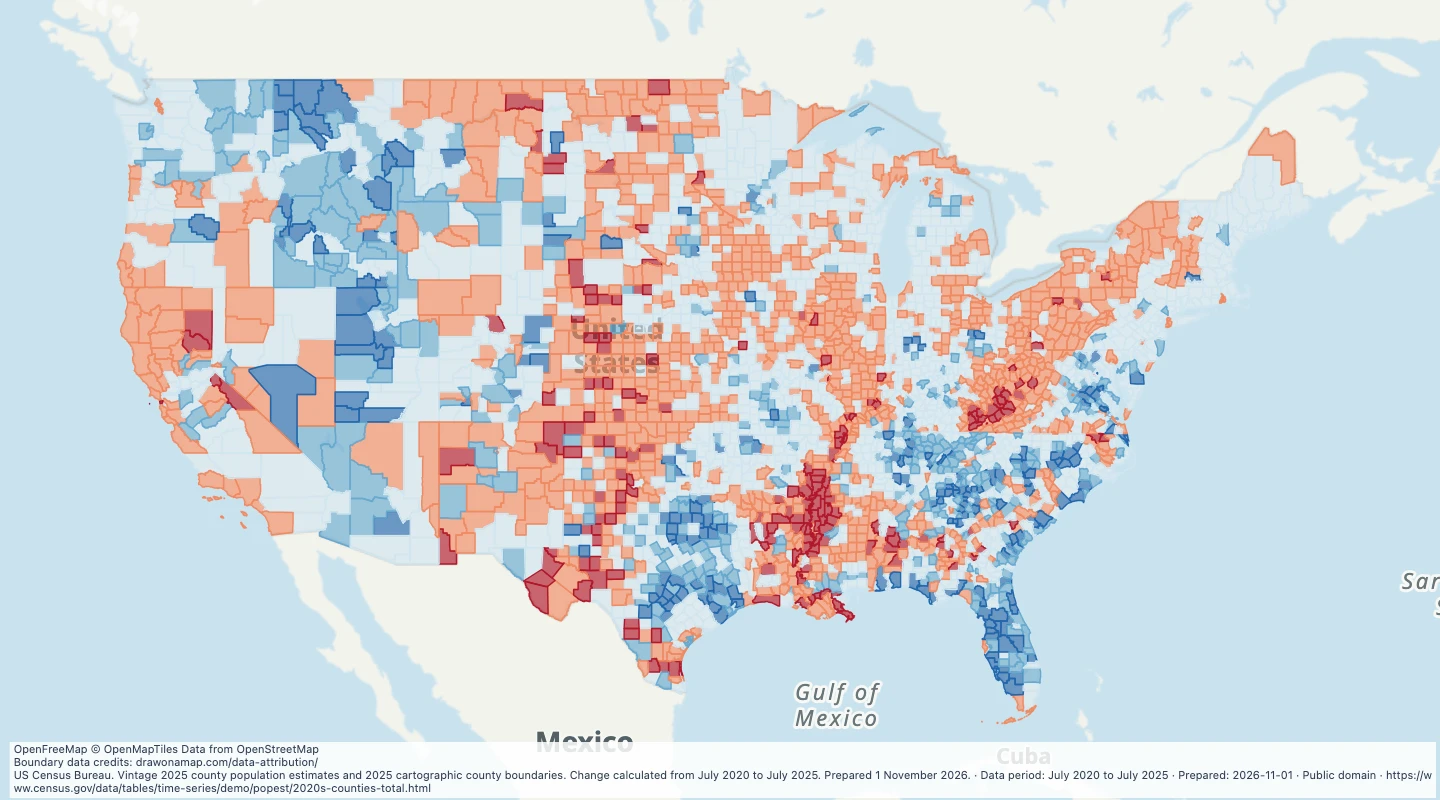 Map features: 3,144
US county population growth, 2020–2025
July 2020 to July 2025
US Census Bureau
Prepared
Compare the share of housing built before 1980 across US counties and inspect the source construction-period estimates.
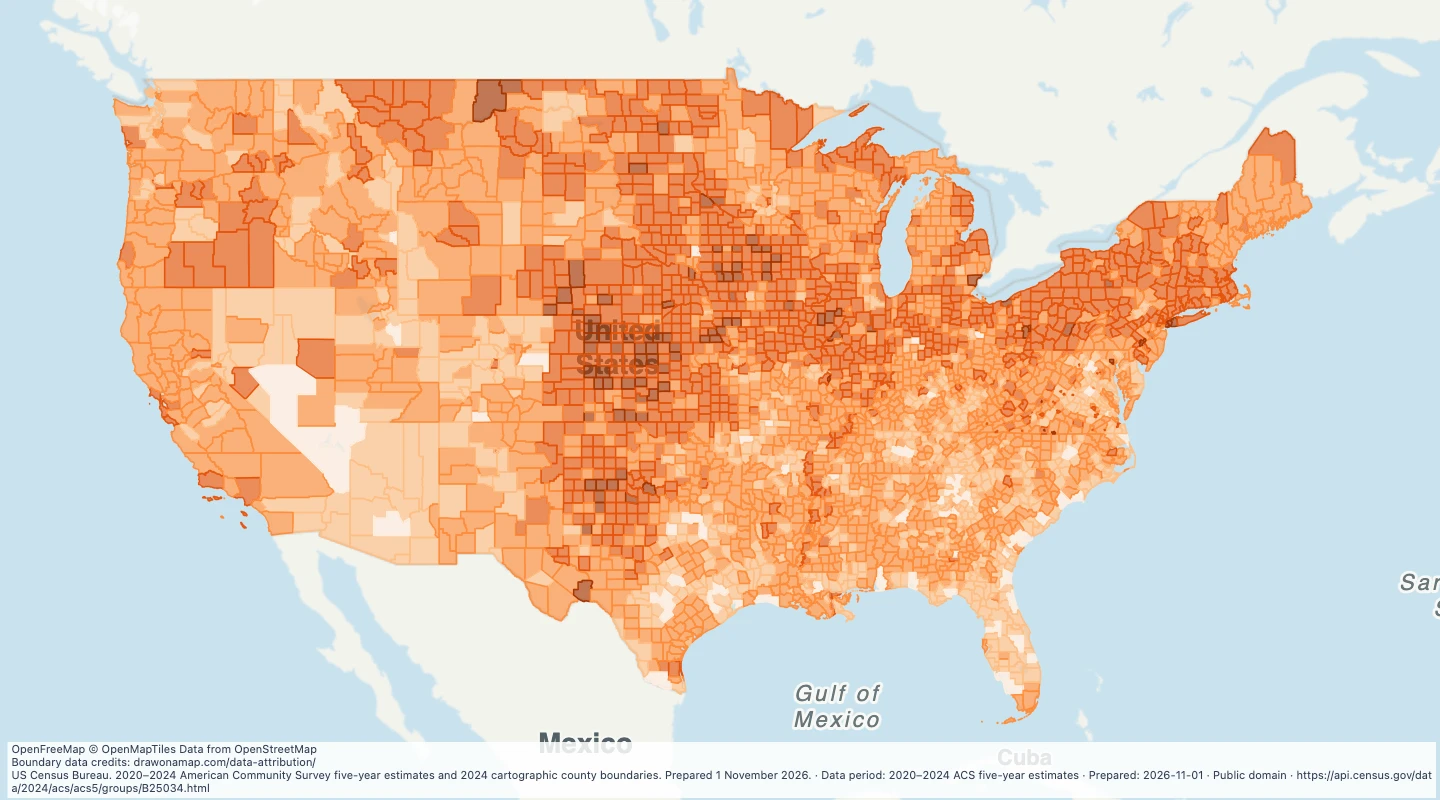
Choose values to filter the preview. Open or download the matching records.
The initial view shows the contiguous United States. All records remain available; pan or zoom to see other areas.
Loading records from the map preview…
The table shows up to eight fields. The download keeps all fields and the original geometry.
Licence: Public domain
The download includes all 3,144 features as area groups, areas. Coordinates use longitude and latitude in WGS84.
The preparation date is when we prepared this dataset. Read the source notes for the dates covered by the data.
namecounty_fipsbuilt_before_1980_pctB25034_E001B25034_M001B25034_E002B25034_M002B25034_E003B25034_M003B25034_E004B25034_M004B25034_E005B25034_M005B25034_E006B25034_M006B25034_E007B25034_M007B25034_E008B25034_M008B25034_E009B25034_M009B25034_E010B25034_M010B25034_E011B25034_M011value_rangeMap features: 3,144July 2020 to July 2025
US Census Bureau
Prepared
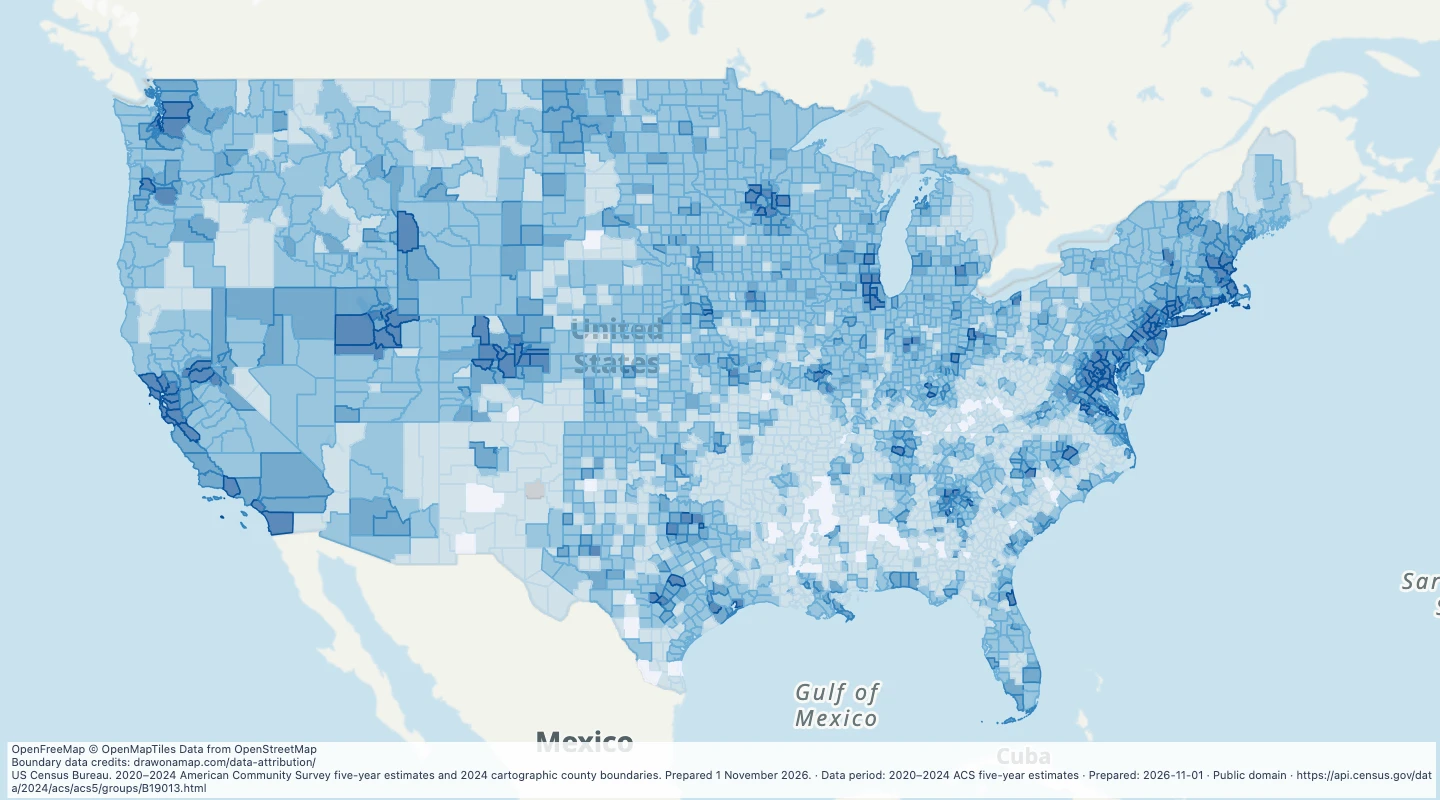 Map features: 3,144
2020–2024 ACS five-year estimates
US Census Bureau
Prepared
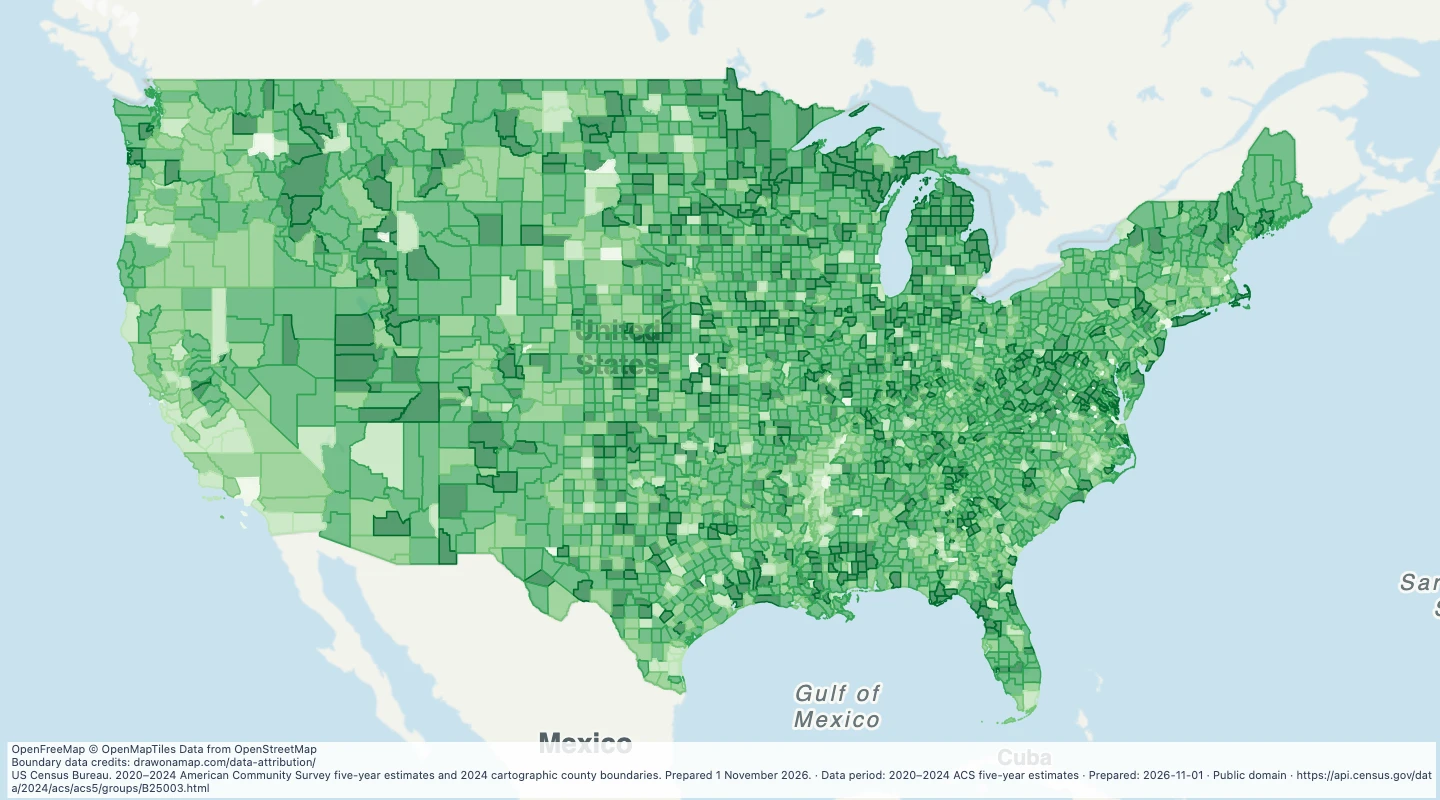 Map features: 3,144
2020–2024 ACS five-year estimates
US Census Bureau
Prepared