Skip to content

US county population growth, 2020–2025

Compare population growth and decline across US counties from July 2020 to July 2025, then add your own service areas and notes.
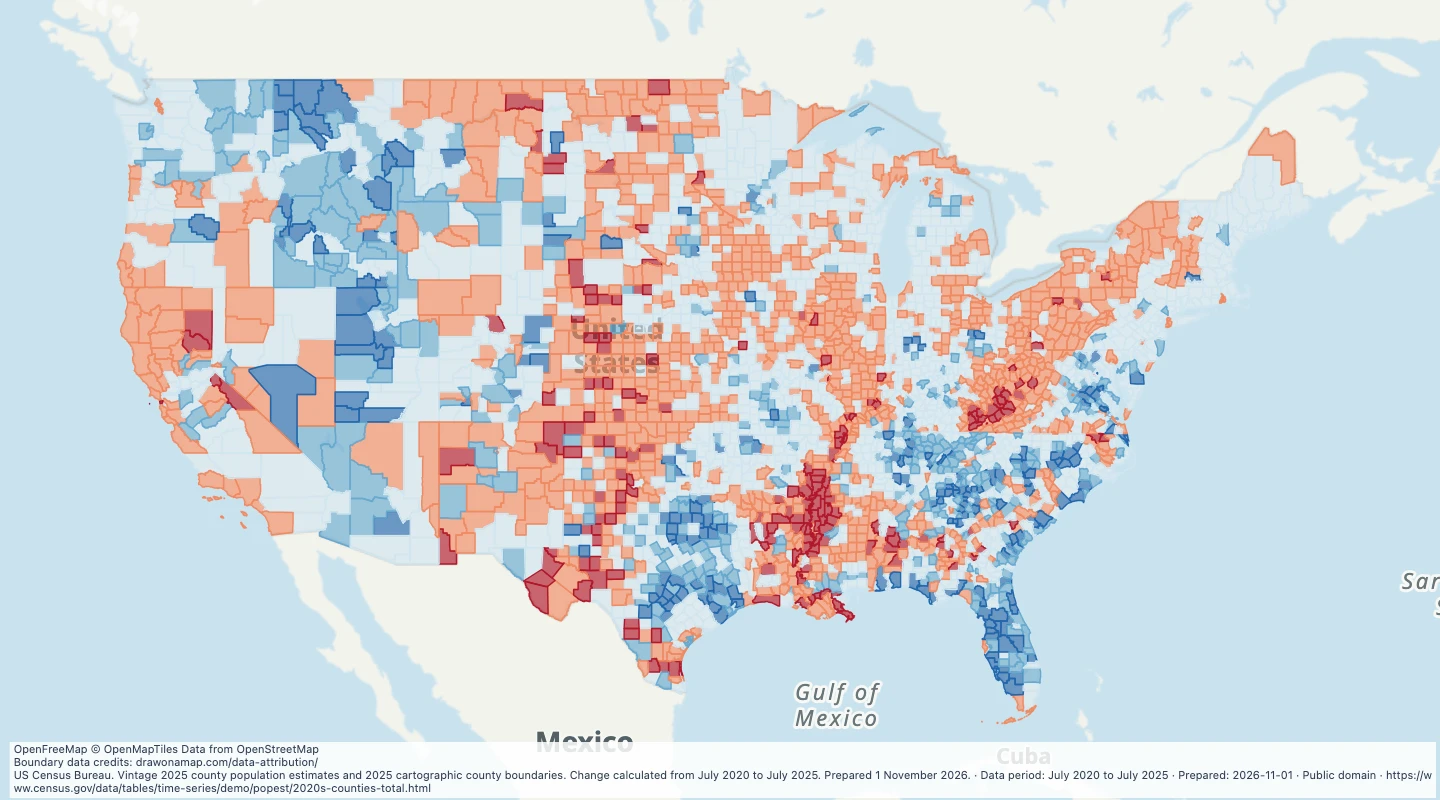
Preview of US county population growth, 2020–2025
US Census Bureau. Vintage 2025 county population estimates and 2025 cartographic county boundaries. Change calculated from July 2020 to July 2025. Prepared 1 November 2026.

Inspect and select records

Choose values to filter the preview. Open or download the matching records.

The initial view shows the contiguous United States. All records remain available; pan or zoom to see other areas.

Loading records from the map preview…

Open selected records
View record table

The table shows up to eight fields. The download keeps all fields and the original geometry.

About this dataset

  • The map covers counties and county equivalents in the 50 states and the District of Columbia; it excludes Puerto Rico and other territories.
  • Both years use the same Vintage 2025 population series. Change compares July 1, 2020 with July 1, 2025, not the April 2020 census count.
  • Percentage change is the difference divided by the 2020 estimate, rounded to four decimal places. Read it with absolute change because a small starting population can produce a large percentage.
  • Blue shows growth and red shows decline. Select a county to read its values and colour range.
  • This reuses the simplified 2025 boundaries from the existing county population-density map; it does not show growth within parts of a county.

Source and licence

US Census Bureau

Licence: Public domain

GeoJSON download details

The download includes all 3,144 features as area groups, areas. Coordinates use longitude and latitude in WGS84.

The preparation date is when we prepared this dataset. Read the source notes for the dates covered by the data.

GeoJSON fields 7
name
County or county-equivalent name.
county_fips
Five-digit Census county geographic identifier.
population_2020
July 1, 2020 population estimate from Vintage 2025.
population_2025
July 1, 2025 population estimate from Vintage 2025.
population_change
2025 estimate minus 2020 estimate.
population_change_pct
Population change divided by the 2020 estimate, as a percentage.
value_range
Display range used for the feature colour; not an additional source estimate.