Skip to content

Show readers where the story happened

Draw a route, mark a reported location, or outline an area with Draw on a Map. Add short notes that connect the map to your article.

Free to draw and share. No account needed.
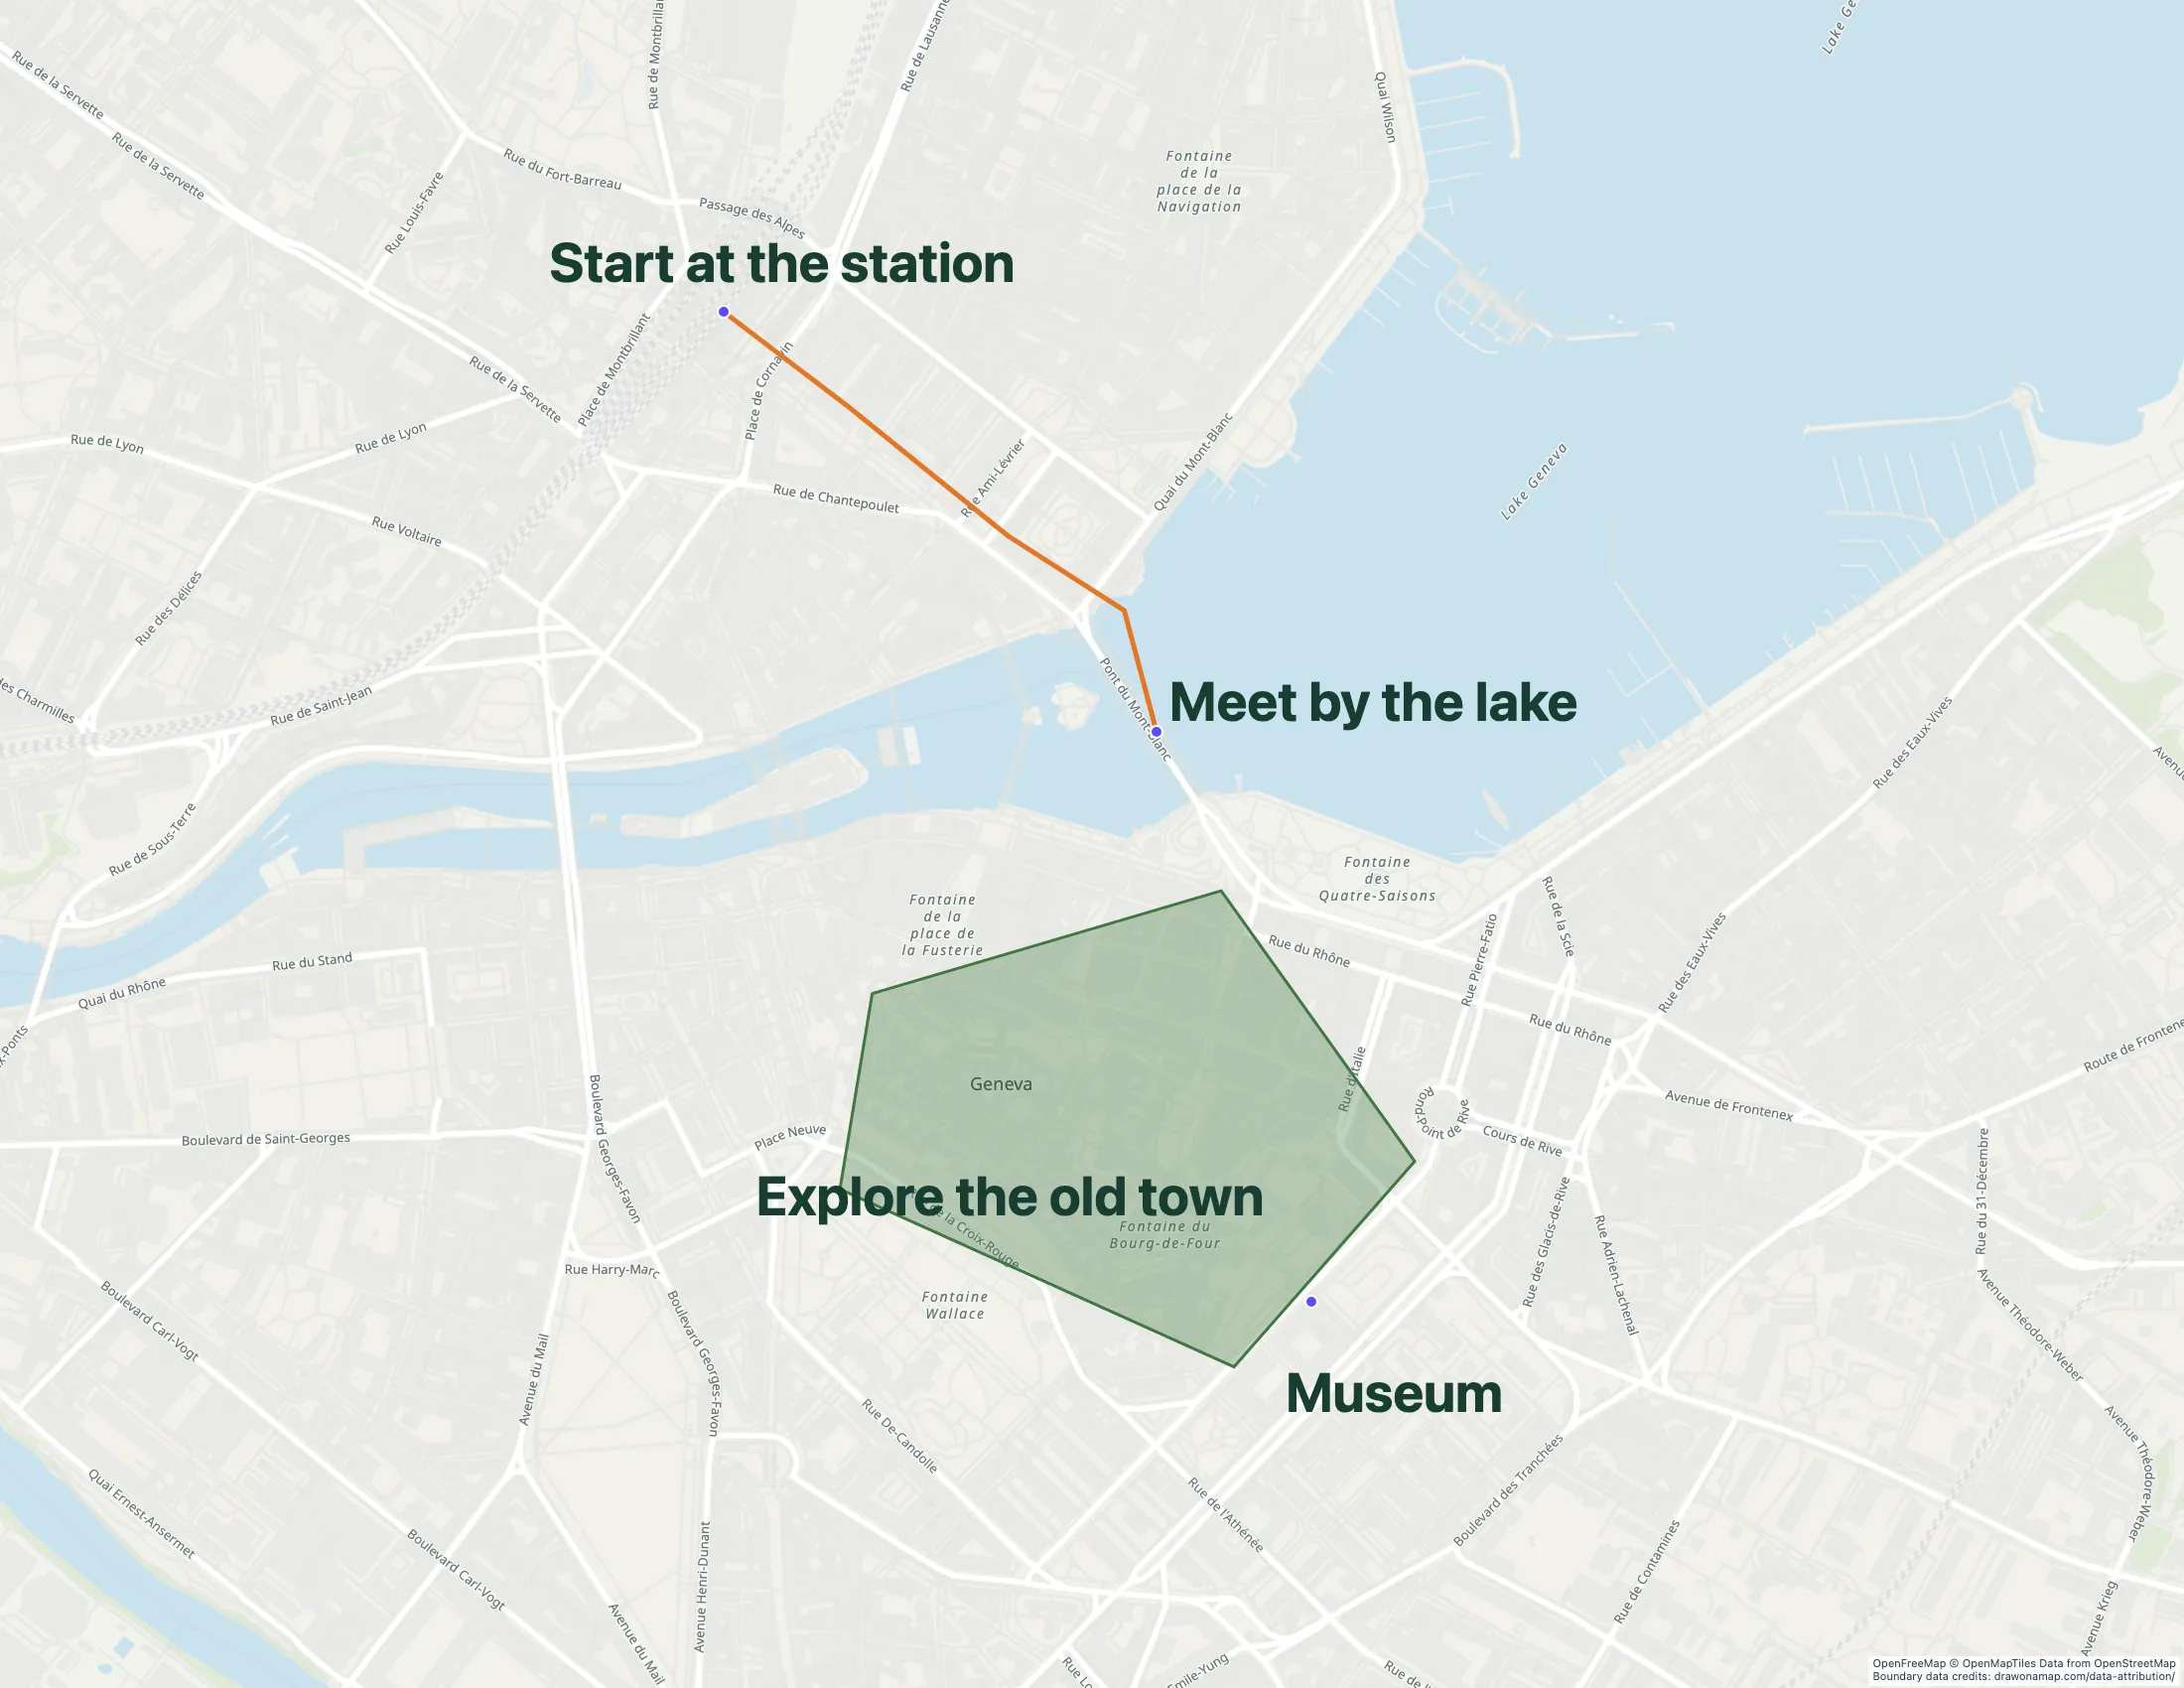
A Geneva walking route with annotations shows how lines and notes can explain a place.

Make the map you need.

Locate the story

Find the place in your report. Set the map view so readers can see the streets and landmarks that matter.

Explain the location

Add a line, boundary, or note to show the reported event. Label approximate locations clearly.

Prepare it for readers

Share a link for free, or export a PNG or PDF for an article illustration. Free downloads have a watermark. Check that the labels remain readable at the published size.

What you can make

Use Draw on a Map to show readers where a story happened. Add a route, boundary, or note, then share a standard link for free. For stories that need geographic data analysis or a browsable place guide, compare the other tools below.

At a glance

Match the tool to your task
ToolBest forCost and access
Draw on a MapA map that explains an articleFree drawing and standard sharing. Image/PDF exports and some sharing features are paid.
FeltGeographic data and shared reviewPersonal is free for non-business use without file uploads. Business use needs a paid plan; a trial is available.
MapmeA location-based public guideStarter is $50/month or $360/year. Higher plans add imports and more locations.

Choose what your map needs

1. Draw on a MapOur product

Best for
A map that explains an article
Cost
Free drawing and standard sharing. Image/PDF exports and some sharing features are paid.

Draw the route described in a report, outline an affected area, or add a note beside a location. Core drawing and standard links are free. PNG and PDF downloads are free with a watermark.

Check the fit: the map needs statistical analysis, a maintained data connection, or an evidence-management system.

Open Draw on a Map

2. Felt

Best for
Geographic data and shared review
Cost
Personal is free for non-business use without file uploads. Business use needs a paid plan; a trial is available.

Consider Felt when the story depends on geographic data and shared review. Check that the input format and review process fit the reporting method.

Check the fit: you only need to point out a road or explain a small area. A full GIS process may add little to that narrow illustration.

Felt product details

3. Mapme

Best for
A location-based public guide
Cost
Starter is $50/month or $360/year. Higher plans add imports and more locations.

Consider Mapme for a public guide where readers browse locations and associated media. Check how the published guide works and how you will update its content.

Check the fit: the main task is analysis of a dataset rather than a visitor directory.

Mapme product details

Make the location part of the explanation

A route map can help readers follow a march or understand a road closure. An outline can show the area discussed in a report. A note can connect a place to a specific part of the article.

Keep the map focused on that question. Show the landmarks readers need and use short labels. Give the main finding in the article text as well, so the map supports the explanation.

Core drawing and standard share links are free in Draw on a Map. If you need a fixed illustration for your publishing system, export a PNG or PDF. Pro removes the watermark. To edit with a colleague in real time, save the map and invite them with Pro.

Match the drawing to the reporting

Use an exact marker only when the source supports an exact location. If the source identifies a neighborhood, show that area and label it as approximate. Keep the source, date, and uncertainty in your reporting records.

For a data story, compare a known subset with the source records. Check for missing locations, duplicates, and unexpected geometry. Keep the original data and a record of how you produced the published result.

Check the published version

  1. Remove private fields that the story does not need.
  2. Use labels that explain what the lines and areas mean.
  3. Open the map on a phone at the article’s actual width.
  4. Check a shared map in a separate browser session.
  5. Add a data date and a correction process if you plan to maintain the map.

Choose a tool for the reporting task

Draw on a Map fits an article that needs a route, area, or location explained. For geographic data work, compare Felt’s input formats and review tools against your method. For a public guide, check whether Mapme’s place pages fit the content readers need to browse.

The Felt alternatives guide compares GIS work with smaller mapping tasks.

Questions

Can I make a map for an article for free?

Core drawing and standard share links are free in Draw on a Map. PNG and PDF downloads are free with a watermark.

Can an editor work on the map with me?

Draw on a Map supports real-time collaboration with Pro. Save the map first. Inviting other editors requires Pro.

Which tool fits a simple route illustration?

Use Draw on a Map to draw a route and add notes. Use a GIS workflow when the story requires geographic data analysis.

Does a map tool verify a location claim?

No. Check the source and match the map detail to the evidence. Label approximate routes and locations.